In today’s video, I explore the brand new AirDNA user interface and its exciting features. I’ve been using AirDNA for years, and the new update is very exciting.
AirDNA is an essential tool for short-term rental investors and property managers. It gives us valuable insights into the performance of both specific properties and markets themselves in various markets worldwide.
With its recent update, AirDNA has made significant improvements to its user interface and subscription structure, offering users access to a wealth of data and enhancing the overall user experience.
I outline the whole thing, what I’m excited about the new version, what I’m excited for about the future updates, and how you can use AirDNA now for your analysis.
🚨 Grab these to learn more about Airbnb investing👇
FREE TRAINING AND STUFF!
Learn how to invest in short term rentals
Click here to subscribe to our YouTube now! Two new videos every week!
Expand Transcript
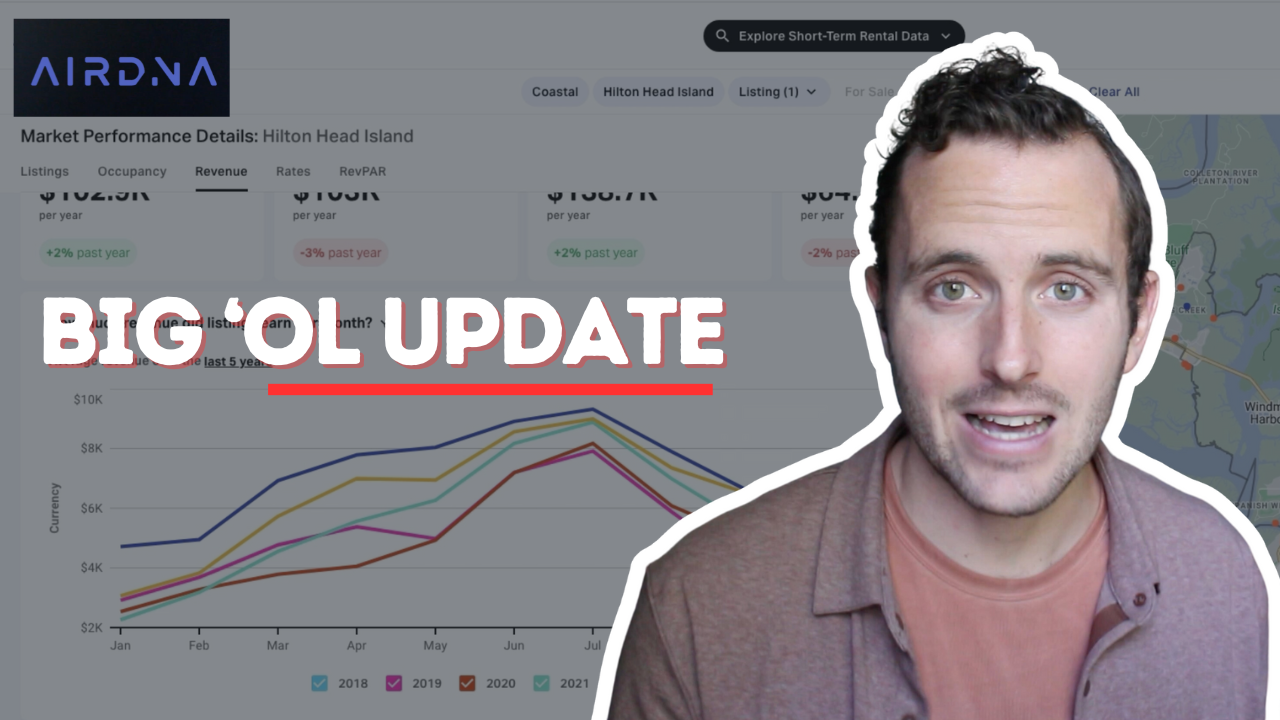
What’s up guys, in today’s video, we’re gonna be going over the brand new air DNA user interface. For those of you who don’t know, air DNA is a really, really great honestly critical tool for any short term rental investor or property manager for that matter, because air DNA is a tool that allows you to see exactly how well other properties in a given market are performing, what their occupancy rates are their nightly rates, all of that data is in air DNA. They’ve been collecting it for years now on short term rental properties all over the world. And they just launched the biggest update in the company’s history to their user interface, and even how subscriptions work before in the past, you had to go and find a specific area on air DNA that you wanted to get access to the data for, and by every single market that you want information on individually. Now on air DNA, you get access to the entire world when you subscribe to any one of their plans. And there’s different tiers that give you different levels of access to different amounts of insight. So we’ve got their enterprise plan that gives us access to everything. So I want to take this opportunity to record a quick video and show you guys through how to use the new air DNA. We’ll probably do some more in depth videos on this later on using it for specific things like analysing properties that we might want to invest in. But I also just want to give him a layout because some things have changed. Some things are hard to find, I recently spoke with their their product team and got a full overview of everything. So I’m just really excited to share how to use this tool because it is honestly so so much better than it used to be. And there’s tonnes of additional improvements that are coming soon. So I’m just really excited to share it. So let’s go ahead and jump in. As you can see, here, we’re looking at the US. And I’m just going to jump into one market so that you guys can see basically how things are laid out. So let’s go into Hilton Head here. And right off the bat, you can see that everything is laid out quite a bit differently. So right now we can see the market overall performance. So these are just basically some high level stats about the property that we always used to have. So that’s great. It also breaks down to two different sub markets. So we can then see exactly which zip codes break down, you can see obviously, there’s a big discrepancy in revenue between these two zip codes. So you can dig more into that and see if there’s a reason behind that data, you can now also go and see a list of all the different active short term rental properties in this market. So you can see there’s 10.3 1000 active listings, and you can go and scroll through all of them and click through them to get more details, you can sort them by review count, revenue, occupancy, daily rate. So that’s really cool. For example, if I want to see some of the highest performing properties in this market, I can just sort by revenue and see, okay, here’s a property that’s bringing in $954,000, and even tells you the revenue potential of this property at $975,000. And you can see this one with a potential revenue of 1.3 million. So you can really see just exactly what makes certain properties, top performers. Now the cool thing about this, that you you never got a list like this in the old UI for air DNA, you basically had to hover over the map and find individual listings, which was honestly a bit of a pain, it wasn’t as easy to sort and filter through like this. What’s even cooler about this is that you can now go and see performance, click on this drop down here. And you can basically do all your filtering. And it’s going to be reflected in the actual list of properties. And you can do the same thing with listing this drop down here. And so for example, if I just want to see the top performing three bedroom properties in the market, I can go boom, here’s three bedroom properties, maybe I want to filter on how many people that accommodates whatever I want to do, I can apply and now only going to see those the properties that meet that search criteria, that filtration in this list. And so I can then sort them by revenue, like I’ve done here and see the top performers, I can also sort by occupancy and see the ones that are booked the most often daily rate review count wherever I want. So that’s really, really cool. They also have a property for sale section that just recently launched. I’m going to be going over that in more detail in another video. But that basically shows you properties for sale in the market. And you can quickly see at a glance exactly what their revenue potential is. So it should make it a lot easier to find properties that basically just meet your criteria and just really quickly filter through properties. Now, this is not a way to do a full blown analysis. But it is a really quick and easy way to filter. And so you can also then search and refine your search by like bedrooms, square footage, price, all these different things. So super cool. Now if we go back over to the market performance tab, there’s actually some really cool more granular detail that we can get about the market overall, that I find super helpful. So just like before, we can now dive into the listings, we can dive into cancellation policies, minimum night stays all these different amenities that they have property managers in the area. So there’s all kinds of data we can gather from all of this and then we can go into occupancy revenue rates and rev part just like we used to before. Guys just want to take a quick break here to say that for those of you watching, who want to build cashflow, and long term wealth by purchasing Airbnbs and short term rental properties, there’s a link in the description right down below for a free training that will walk you through my exact strategy for investing successfully in Airbnb. Now if you’re not ready to rock To buy properties and you want to get started managing other people’s properties on Airbnb the same way I got started and build a full time income managing other people’s properties, there’s actually another free training linked in the description down below as well, that’ll be a really great fit for you. So whether you want to invest in short term rental properties, and actually build amazing cashflow, and long term wealth by acquiring the assets, buying the properties themselves, or you’re looking to earn a full time income, managing other people’s properties on Airbnb, we’ve got some awesome trainings that are linked in the description down below, that’ll definitely help you out. When you sign up for the trainings, we’re also going to send you a few other tools and resources completely for free just to help you get started. Again, the links to sign up are in the description down below. And both trainings and all the tools are completely free. So make sure to register for the trainings, links in the description down below. The difference here is that now you can go back up to five years in the past and get it all in the chart, which I think is just really cool. You can see it charted how things have evolved over the last five years in this market. This is for occupancy rate, what I find even more interesting is obviously revenue, you can look at over five years, see how revenue is performed. You can also just like you did before, this is a trickier one to find. I thought this was a feature that they had gotten rid of and I was really, really upset about it, it turns out, it’s just a little bit harder to find is you can actually still look at the different percentiles breakdown. And so you can see over the last 12 months or over the last five years, exactly how well certain properties performed based on where they were out in the market. 75th percentile properties being in pink here. These are the ones that are the basically the top 25% of performers in the market 90th percentile being the top 10% of performers in the mark so you can see the breakdown and see where you think you would land based on how well you think you are going to do and your property is going to do as a short term rental. So that’s really cool. There’s a few different ways that you can filter this as well like by bedroom, for example, you can look at that, you can look at the real estate type making revenue. So I haven’t even looked at this before. But this yeah basically just breaks down unique versus b&b versus apartment versus house. So that’s another cool way to filter your results. And in line with what they had an update they launched not too long ago, you can export all this data as well. So that makes it really, really helpful. Because for example, if I want to know, for this market, let’s say I want to look at three bedroom properties like I filtered for here. And by the way, that filter applies over here as well. So all the data in this chart is gonna be for three bedroom properties. If I wanted to go for for bedroom properties, I can just update that here, change these numbers, hit Apply, and then boom, my chart is going to update. So super cool there. Now what if I wanted to go and grab the five year data here, and then export it, and then I can start to see trends. So I can do things like pull this up. And I’ve actually got a macro built that will basically break this down in more detail for me. So I can just go over here, run my macro. There we go. And this, this basically now tells me okay, you know, the 75th percentile performers are trending in this direction, the 50th percentile performers are trending in this direction, I can see where the market is headed overall, based on revenue performance, super, super helpful. When you’re looking at analysing a property to purchase, being able to look at the high level view of how property’s performing in market is super, super helpful. And then the fact that you can then jump over here, and you can now scroll back up, go over to the 860 active listings and look for specific qualitative comps chef’s kiss, that really makes it a lot easier and more accurate to run your analysis using air DNA for a property you’re looking at buying. So these are some of my favourite features of the new air DNA. And they’re also coming out, like I said, with some more additional features that are going to be even cooler. So you can see here coming soon as hosts do unit count. So you’ll be able to filter properties by the number of units that a host has, you’ll also be able to filter by days available. This honestly is one of the ones I’m most excited for. Because what that allows you to do is filter for specifically full time properties. You can see in here that this property only had 158 days available, this property only had 79 days available. And so although it’s saying on air DNA, this had a revenue potential of $285,000, it only actually generated $87,000. So it’s really a little bit speculative to say that it actually would have done 285. And so it’s really hard to draw accurate conclusions just based on this, it’s much nicer to be able to see units like this one that was available for longer and actually hit 146 It’s not speculative, they actually hit that out of the 249 days they are available. So just really nice to be able to then filter the properties by number of of listings or days available so you can get more accurate analysis. Again, review count is another big one. So you can filter for listings that have more reviews that have more track record, and then also filter for listings that have fewer ones so you might have a clearer picture of how your listing would do initially when you first launch it. So those are all really cool for sale properties, like I mentioned is one that just came out that I personally am quite excited for and the one that I am personally The most excited for the new feature coming out is this feature right here, the draw map tool. So this one’s coming soon. And from speaking with their DNA, they’re telling me that it should be, don’t quote me on this, don’t shoot the messenger, but it should be available by the end of this year. And so I’m really excited for that. Because what this tool is going to allow you to do is really honestly incredible, it’s gonna allow you to basically draw a custom area on the map and then look at the stats for that specific area. Now, the reason that is so so, so, so helpful, is because in a lot of markets, where you’re around lakes, let’s look at for example, I’m going to look at another area here, I’m going to go with Kawartha Lakes, I think that yeah, quarter lakes Ontario. So if I look at this market, you can see that this market in here, let’s go in. And if we zoom in, you can see, okay, so for me to analyse a property that is sitting somewhere in here, it spills into two different markets. So you can see that if I’m in the core of the lakes market, let me zoom back out. So I get that overview, you can see that part of this lake is in the corner lakes market, and part of it is in the Peterborough market over here. And so if I want to analyse a property that’s sitting on this lake, it will be way more helpful and more accurate for maybe I’ll just draw a circle around this lake and see how lakefront properties in that area perform. And then for other areas, there’s a limited amount of data in a specific more rural market take this market, like men and hills, for example, there’s tonnes of these all throughout the US all throughout the world. Honestly, the way they’ve broken them up sometimes just doesn’t make that much sense. And so if I only have a small amount of data in this market, let’s say min and hills, let’s take a look. So you can see there’s only 64 active listings that actually meet my search criteria in here. And so what if I could just draw a bigger area around mindand hills and capture some of the data from all these surrounding areas here as well, that would obviously be super, super helpful in order to just get more data to influence my decision making. And so being able to draw on the map is just going to really make it a lot more flexible, the way that you actually run your numbers on a given property. And it’s going to make it so that your numbers can be a lot more accurate. So I’m really, really excited for that, it’s going to then allow you to gather all that data. And so it’s just personally something I’m super excited for, because it’s going to allow us as investors to paint a more accurate picture of what our listing is going to look like how it’s going to perform. And ultimately, that’s just something I’m super, super excited for and fingers crossed it should be coming out before the end of the year. So that’s all for now. I’m gonna like I said have a more detailed video going over listings for sale and going through that functionality there because I think that’s super cool for any of you short term rental investors out there. But if you have any questions, any comments, any thoughts, let me know in the comment section down below. Just drop them in the comments. If you liked this video If you got value from it if you thought it was helpful in any way shape, or form or if you just want to be nice, just click down below hit the like button it really really does help me out with growing this channel and growing these videos and getting these videos for more people. So thank you so much for watching this video. Last but not least, if you are new here or you’re not yet subscribed, make sure you hit that subscribe button down there as well. You can stay up to date with the two new videos you post every single week without fail on this channel. All that being said thank you so much for watching guys, and I’ll see you in the next video.