This single page will show you everything you need to know for a proper Airbnb pricing strategy.
This is the exact process we use for my own properties. We teach this to our BNB Inner Circle members. And we’ve all had great success.
It’s terrible to have an empty calendar, but pricing is the solution to this.
The right pricing strategy manages your occupancy.
Let’s dive in.
Target Occupancy Tracking Technique
When we think about pricing, we need to think about hitting an occupancy target.
That’s why I call this the Target Occupancy Tracking Technique.
First, let’s set up how we’ll monitor our occupancy.
How to set up and monitor Airbnb pricing
1. Create Your Own Pricing Spreadsheet

I use spreadsheets for a lot of things when I need to track something. And for this, it’s perfect.
We need to track the month, mostly. Because short term rentals are very seasonal, each month is a bit like it’s own bubble. I can help to think of each month as its own little universe to manage.
We’ll dive into how to use the sheet in the next section.
But we need to track a few things:
Days remaining in the month
It’s self explanatory why this is useful, but you want to know how long you have until the month you’re monitoring closes. For the spreadsheet gurus, you can use a formula to automatically track this. For example, for Google sheets, this is the DAYS function, where the first variable is the last day of the month (in this example it’s April) and the second variable just pulls in today’s date automatically:
=DAYS( 4/30/23 , today())
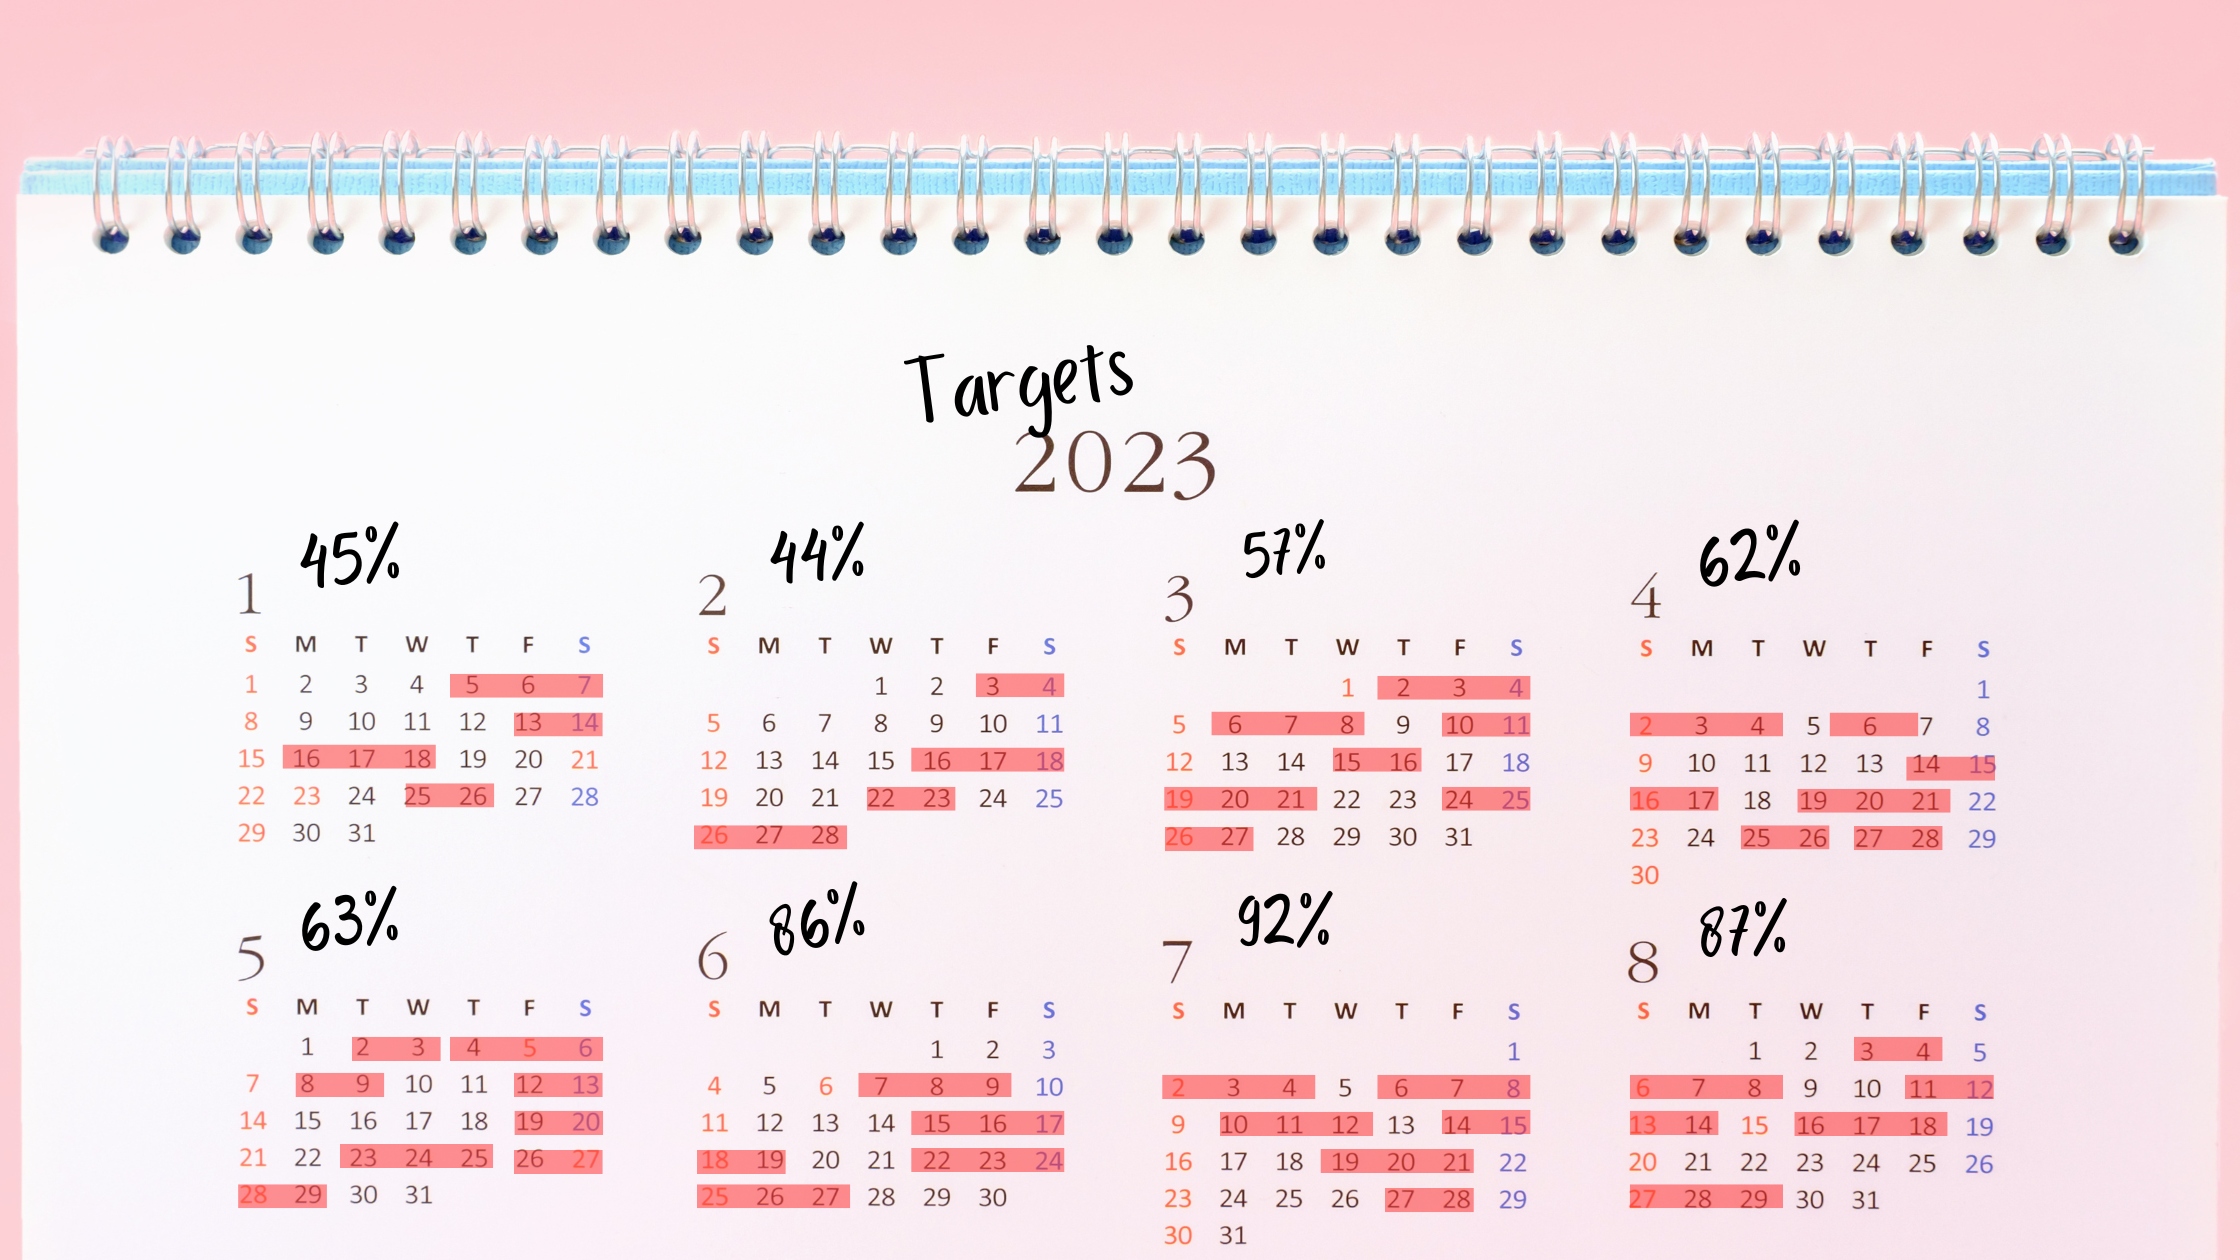
Seasonal occupancy rate
Short term rentals are very seasonal. We won’t earn the same amount of money each month like a long term rental. And each month or season won’t have the same demand and occupancy.
This column is the occupancy rate we’re wanting for that month by the time the month ends.
Target days booked
This is a formula based on the days of that month multiplied by the seasonal occupancy rate.
Target of occupancy rate
If the previous two are telling us what we’re aiming for by the end of the month, this one and Target Days Now (next) are what we’re aiming for at this moment.
We’ll use booking lead time to find this value in the next section.
Target days now
So much math!
This is how many days we should have booked at this moment as we approach the end of the month we’re aiming for. The formula is:
Total days that month * Seasonal occupancy rate * Target of occupancy rate
Actual booked
Simple: Enter how many days are booked for that month, which you can compare to how many you should have booked (the Target days now value).
(Optional) Target & Actual revenue
I generally don’t recommend this for anyone just getting started with this. Tracking occupancy is the leading indicator. Occupancy is the stat that affects revenue, not the other way around.
So feel free to aim for and track revenues, but always remember that’s a byproduct of our decisions with pricing for occupancy. If we price for revenue, we will not get the results we want.
Want to grab our copy of the pricing optimization spreadsheet and watch me use it?
Join our Facebook Group here and search #pricing
2. Find your market’s booking lead time
We constantly monitor where we are in relation to the final day of the upcoming month we’re looking at. In other words, we won’t get all of our bookings for February in February, and we certainly don’t wait for February to check on February bookings.
This is where booking lead time can come into play.
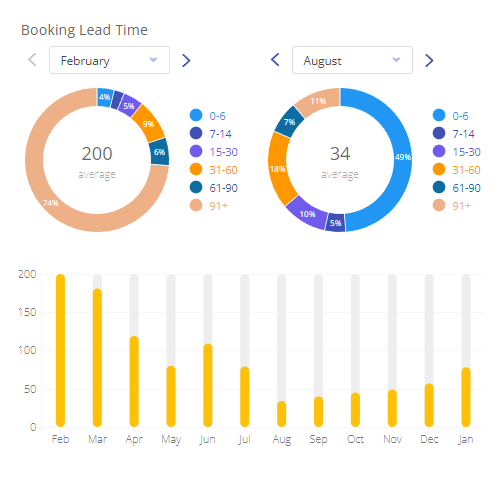
You can see using these two different booking lead time charts for the same Florida market.
Note for this chart, it shows how many days someone booked before the first day of their stay. But we don’t know which part of the month. You can assume the 15th if you like.
For your sheet, can either manually record the percent booked for the time frames for each month, or use generalizations for now by season. Because “Days remaining in month” counts until the end of the month and we’re using the start of the month for this chart, be sure to add about two weeks to these dates.
We can see roughly when people book as the days approach using the Booking Lead Time chart on the Seasonality page. In the Florida market in February, ¾ of all bookings are made over 90 days in advance.
In other words, if you’re Using February, you should have 74% of your target 16 days (to continue our example from above) or 12 days booked by the time you hit 3 months to go to the start of that month (aka by the time we hit November). Then, seeing 6-9% of bookings happening each month from there, you should fill in February at a trickle each month.
Now look at August. We should only have 11% of our target days that month booked by the time we have three months to go. And as you can see, we can expect to get HALF of our bookings “last minute.”
So what’s our takeaway?
First, if you wait until the last minute to adjust pricing to affect occupancy, you’re waiting too long. Obviously you want to be keeping an eye on this regularly.
Second, we should start checking our occupancy and adjust pricing more than 90 days in advance. We suggest starting at 6 months until the month you’re aiming for.
3. Find your market’s occupancy rate targets
Software like AirDNA helps tremendously with our Airbnb pricing strategy. We can see the average occupancy for our market after filtering for property type. For example, we only want to see four bedroom properties if that’s what we have.
Exporting the data by month will give you five years of averages. Place this alongside each month in your sheet so you know what you’re actually aiming for in each month.
Pro tip: Because exported data only shows the average, by adding 10% to the average target from what’s seen, you can be a bit more aggressive. This ensures lower prices during your first year, where it’s crucial to prove to the Airbnb platform that you are bookable.
So for example, if the average for February comes out at 48%, put your Seasonal occupancy rate target at 58%. So 58% of 28 total in February means 16 days we need booked for February.
Let’s see another example: August in Gatlinburg.
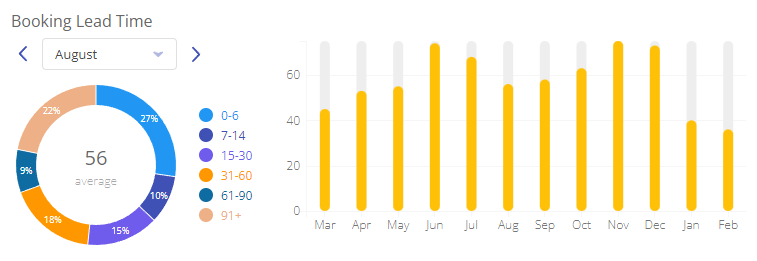
We’ll say we exported our occupancy rates (which we’ll targeting 90% occupancy by the time August ends.
For August’s Target occupancy rate (from booking lead time) I’d put:
1-15 days: 95%*
16-30 days: 24+9+18+13 = 64%
31-60 days: 24+9+18 = 51%
61-90 days: 24+9 = 33%
91-180 days: 24%
* I’ve always just used 95%. You can aim for 100% of your target occupancy if you like. I also like to say 1-15 days because everything else is in multiples of 15. Is that weird?
Again, using spreadsheet formulas we can automatically have it reference the table of percentiles and pull that information into the Target of Occupancy Rate cell.
Or, if that’s a little tricky, I’ve got good news. Most markets, overall, follow a similar trend. The Florida market above has wild swings, but you’ll see comparatively that Gatlinburg does not. For most markets, you’d be safe to use this as a rule of thumb:
1-15 days: 95%
16-30 days: 75%
31-60 days: 50%
61-90 days: 25%
91-180 days: 10%
4. Fill in current numbers
If you’re starting now, you might as well fill in the columns that you can. This will be actual booked now, mostly.
If you don’t have your spreadsheet automatically pulling in the percentiles for booking lead time, fill those in too depending on how many days are remaining from the Days Remaining column.
Example: If there are 42 days remaining, using the basic booking lead time chart we’d be aiming for 50% of our actual target nights booked for right now. That numbers goes in the sheet.
Weekly Tasks (Airbnb Pricing Optimization in 30 Minutes)
1. Optional: Fill in revenue from the month
If you’re choosing to do this, you can monitor your finances on this sheet. Like any accounting method, pick one way and stick to it. There are generally two methods for a month:
- Count revenue for each day depending on the day they’re staying. This way can get tricky.
- Count total revenue for the entire stay and “count” it depending on their check-in date. So for example, a 5 day $1,000 booking that starts on February 28th would entirely go into February.
2. Fill in days booked for that month
Some property management softwares can count these for you. If all else fails, simply count how many days you have booked for that month.
Place this number into the Actual Booked column.
3. Verify where you are versus your target
Now that we know where are for each month, we need to compare this to where we want to be right now, given which booking lead time frame or stage we are in.
For example:
Say it’s March, and we’ve got 8 days booked so far for May.
Does that seem low? Seems low, we should probably panic, yeah?
AirDNA says we should get 57% occupancy for May. We added 10% so we’re aiming for 67%.
It shows 82 days remaining until the end of May. That puts us in the “61-90 days” stage. This means 25% of our target.
Stage x target x days in month
25% x 67% x 31 = 5.1 days should be booked while we’re in this “stage”.
4. Adjust Prices
In our example, we should have 5 days booked, but we actually have 8 days booked.
There’s a higher demand than we expect for our market for that month.
So we raise prices to slow down the bookings. In this case, we can probably raise prices a good 15-20%.
Conversely, let’s say we were actually at zero bookings for May, and we need 5.
The demand is not high enough to warrant the prices we’re asking. So we need to lower them, and by a lot.
In either case, it’s much better that we’re catching this well in advance. In March, we’re watching up to 180 days out.
As time goes on, we’re checking every week and updating our sheet.
We’re seeing how many days are left until the end of the next month. And the next, and the next, and the next, up to six months in advance.
And depending on the stage and targets, we’re adjusting our prices.
If you’re wondering how aggressive to be during your adjustments, consider the season. Or in our case, the month.
If the month typically has high demand, your reductions can be more gradual, and increases can be a bit more aggressive. Those days are likely to get booked.
If it’s a typically low demand month, you want to err on the side of lower prices. So be aggressive in your reductions, and lighter on your increases.
And just like month-to-month, the same applies to weekend versus weekday.
There’s usually more demand for weekends, so reduce less aggressively when needed and increase more aggressively when needed. And vice versa for weekdays.
How to automate Airbnb dynamic pricing
I see smart pricing like driving a Formula 1 car.
If you’ve never use such a powerful machine, you’re just going to crash and burn. Such a pricing tool is best saved for professionals who really understand how the machine works and how to make the most of it.
If you hop straight into pricing automation without really knowing what it’s doing, you run the risk of crashing and burning.
What does that look like for pricing optimization?
I highly recommend at least four months of manually adjusting your pricing to see what it’s doing. Pricing automation is not the magic switch you think it is, if you really want to maximize revenue.
By understanding overall pricing strategy and a data-driven approach to optimize rates, you can start using pricing automation tools effectively.
You should understand how unique factors affect supply and demand for your specific property. If your property is completely cookie-cutter, you may not need to wait the four months. But if your property is unique in any way, you need to feel it out by doing it manually.
Now, when it comes to pricing automation software, there are three big players in the market: PriceLabs, Wheelhouse, and Beyond Pricing. After looking into all three, my personal favorite is PriceLabs.
PriceLabs allows for the best inputs for a robust strategy, which I like. It’s got more options for tweaking pricing once you have a good understanding of it.
It also provides great metrics and a market dashboard. I love data, so it’s perfect.
Pricing is very high leverage activity for property owners, and should be one of the last things you try to automate. If everything else in your business is optimized, you can look at it.
The goal of pricing automation software isn’t to make you more money. It’s to take the process you know works for your property and automate it to save you time.
Conclusion
There you have it: my Target Occupancy Tracking formula when making your Airbnb pricing strategy.
I’ll say it until I’m blue in the face: pricing optimization is THE thing short term rental investors should be doing but aren’t.
And now that you know, you can start too.
PS – If you’re interested, I send out three emails every week to serious investors just packed with information like this. Check out my free training video here, where you’ll learn the three things you need to be a successful investor, and start getting my free Airbnb investor-focused emails, and get my personal investment property ROI calculator spreadsheet free. Click here to get started.